Tracing identity through a request
The Mesh Series · Article 26
Distributed tracingLGTM stackCompliance evidenceIstioOpenTelemetry.NET & C#Audit logging
The Mesh Series · Article 26 — a field guide for regulated cloud
You have the audit log now. Every hop writes a line: this workload, that principal, this verdict. It's uniform, it's signed-adjacent, it survives eighteen months. Good.
Then the regulator asks a different question. Not “what happened on service X.” “Show me everything this customer's session touched, across every service, for this one transaction.” And you go quiet — because your logs are a stack of per-service diaries and nobody wrote the index that ties them into one story.
That index is a trace. And most teams have tracing switched on already, feel covered, and are wrong about what it's covering.
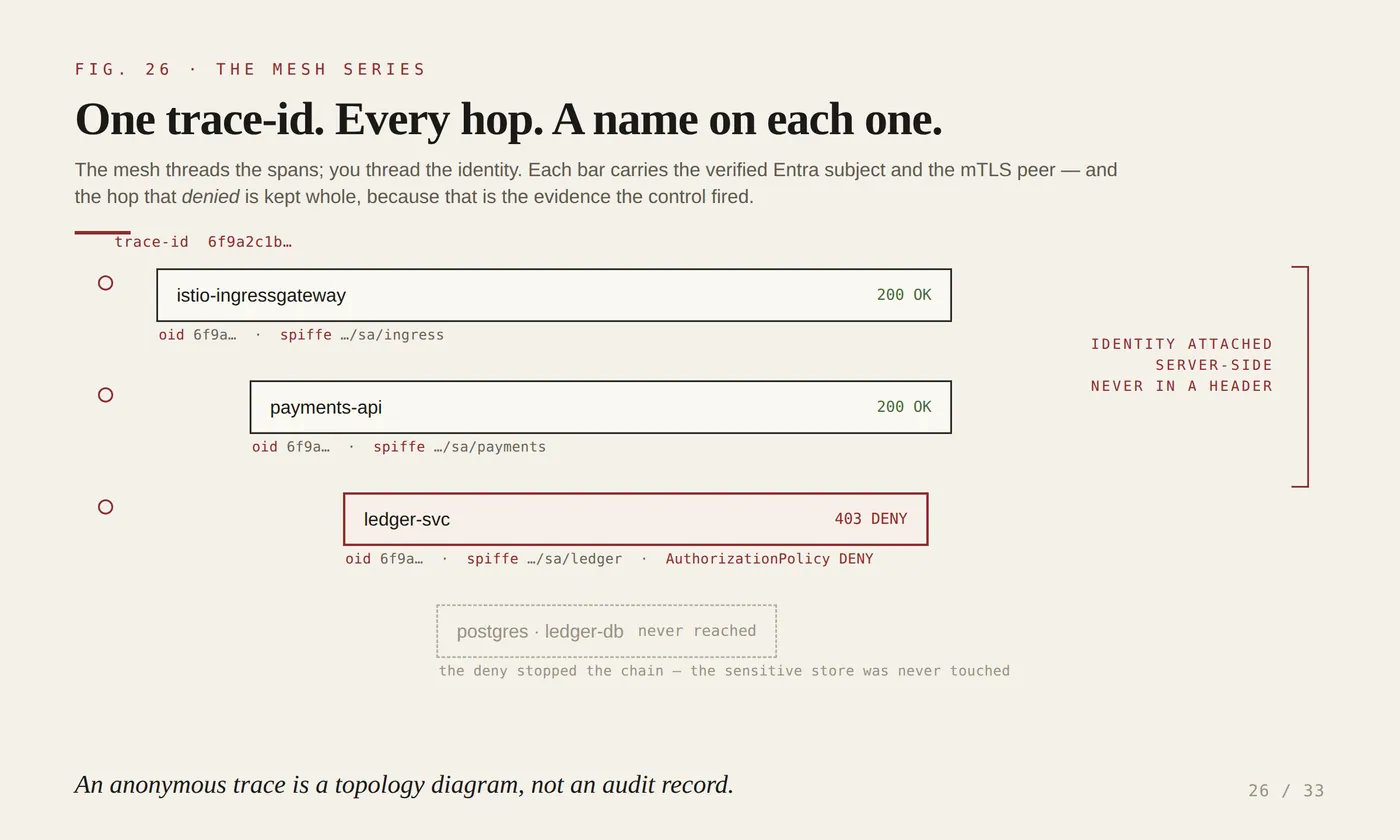
A trace is the stitched account of a single request as it fans across your services. One request enters the gateway, calls an API, which calls two downstreams, one of which hits the store — and a trace is that whole shape rendered as a waterfall of spans, all threaded onto one trace-id. Tempo keeps them. Grafana draws them. You've seen the picture: a tidy cascade of coloured bars, each bar a hop, the total width your latency.
Here is the thing the picture doesn't tell you: whose request it was.
An anonymous trace is a topology diagram, not an audit record
The default trace answers an operations question — did the request go through, and where did it spend its time. That's the 2 a.m. question, and tracing was built to answer it beautifully. But “the request succeeded in 240ms” is not something a regulator ever asks you to prove.
The audit question is different. Whose request. Under whose authority. Did the customer's identity ride every single hop, or did it get laundered into a service account somewhere in the middle, so that by the time you reach the ledger the trace says “the payments service did it” and can no longer say who asked?
That distinction is the whole demo-to-audit gap, one more time. A trace with no identity on it is a fast, pretty map of your topology. It tells you the shape of the call. It cannot tell you the person. For an operator that's fine. For an auditor reconstructing a disputed transaction, a topology map is worthless — they already have your architecture diagram.
Both India and the Gulf make this concrete. RBI expects you to reconstruct a specific customer's activity when a transaction is disputed, and to do it inside the country. SAMA's maturity model wants evidence that the control ran — not that it exists on a slide, but that this actual request passed through it. A trace threaded with identity is how you answer both in one artefact instead of grepping six services and stapling the output together in Notepad and hoping the timestamps line up.
The mesh threads the trace. It does not thread the identity.
Here's where teams get quietly burned, so read this twice.
Turn on tracing in Istio — the Telemetry API pointed at an OpenTelemetry provider — and Envoy starts emitting a span for every call it proxies. Feels like distributed tracing arrived for free. It didn't, not the part you need.
Envoy has no way to know that the outbound call your API just made is because of the inbound call it received a moment ago. The sidecar sees two separate requests. Only your application code knows one caused the other. So unless your app copies the trace headers — traceparent, tracestate (or the older b3 set) — from the incoming request onto every outgoing call, Envoy stitches nothing. You get a pile of orphan single-span traces that each look complete and collectively prove nothing. Istio's own documentation says it plainly: applications are responsible for propagating the tracing headers. The mesh gives you the ends; you thread the needle.
In .NET this is the one piece you mostly get handed back. System.Diagnostics.Activity is the native span, ActivitySource is how you emit one, and .NET has spoken W3C traceparent by default for years. The OpenTelemetry ASP.NET Core and HttpClient instrumentation reads the incoming header and writes it onto outgoing calls without you lifting a finger. That's the trace-id propagation solved.
The identity is a second, separate job — and nobody hands you that one.
The naive move is to shove the user's identity into the trace context so it rides along with the headers. Do not. Trace context and baggage travel as cleartext HTTP headers, hop to hop, and baggage in particular will happily walk right past your trust boundary into a third party you don't control. Putting a customer email — or worse, a token — in baggage is how you turn your observability pipeline into a data-leak. OpenTelemetry's own guidance is blunt: baggage is for non-sensitive context, not secrets and not PII.
So you attach identity the right way: server-side, on the span, from the token you already validated. You did the five-gate JWT check at the edge and in code back in Article 12. The verified sub and oid are sitting right there in HttpContext.User. You tag the current span with them. They never travelled in a header you don't own — they were minted onto the span inside your process, from a claim you already proved. And Entra's oid/sub are opaque, stable GUIDs, not the customer's email — which means they're a genuine identifier for correlation and they aren't the PII you'd have to scrub. That's the rare case where the secure choice and the convenient choice are the same choice.
Show me
Wire the pipeline once, at startup. Auto-instrument the transport, name the service, ship to Tempo over OTLP.
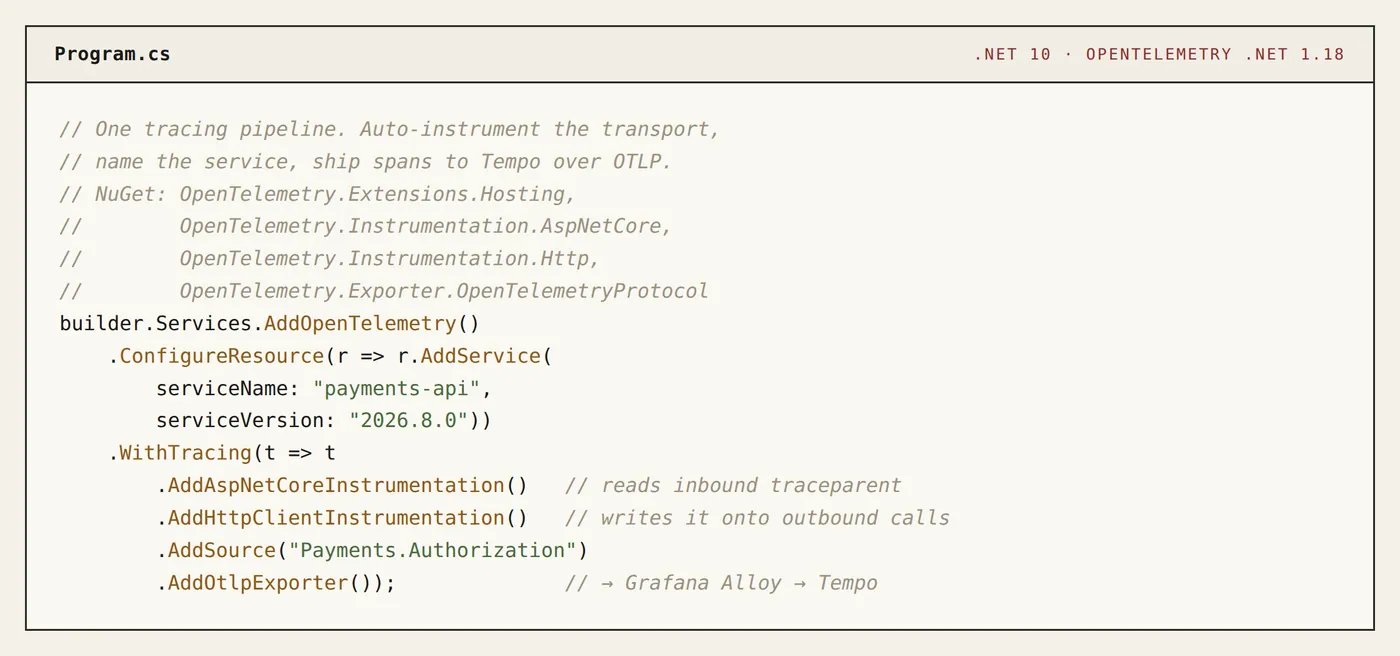
That gets you a stitched trace. It is still anonymous. Now put a name on it — after authentication, never before — reading only claims you already verified:
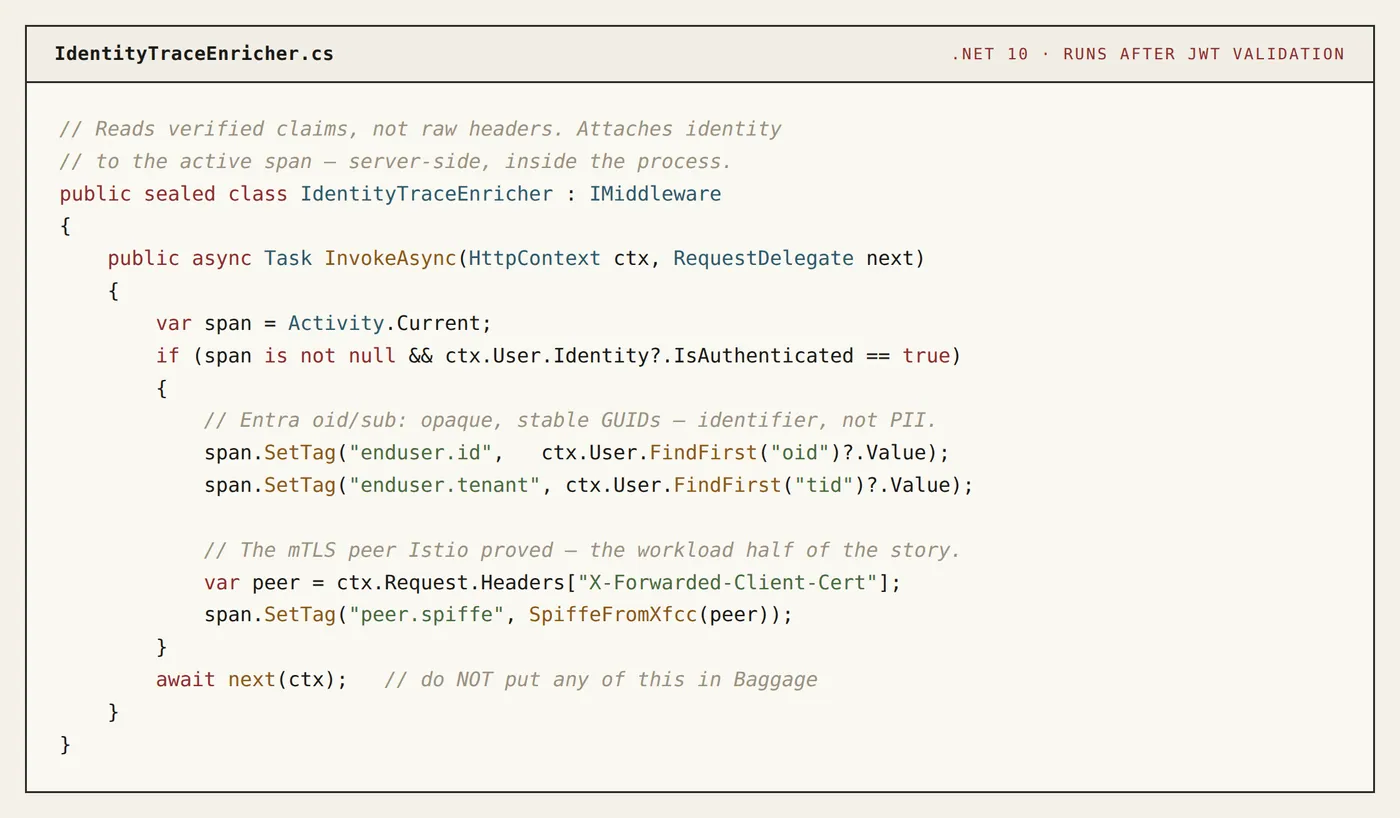
Now every span the request touches carries the customer's opaque id and the workload's SPIFFE identity — the user plane and the workload plane, on the same bar in the waterfall. Point Istio at the same collector so the mesh's spans and your app's spans land in one trace, and set a sane sample rate:
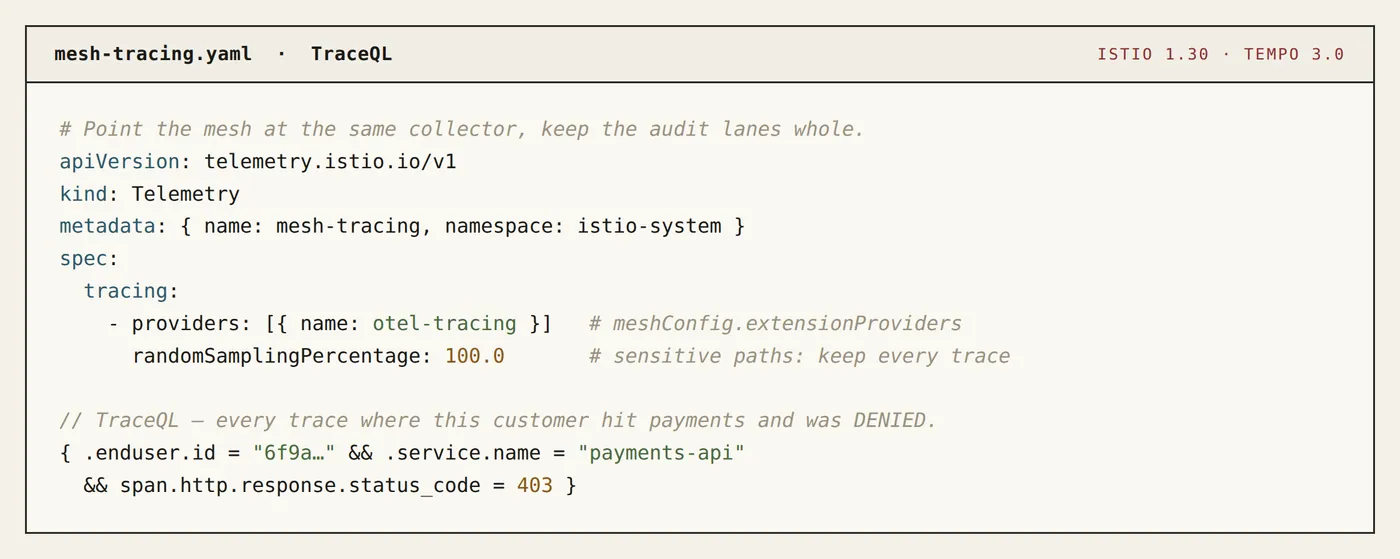
The last query is the point of the whole exercise. You just asked your trace store “show me this specific person's denied attempts against this specific service,” and it answered — because the identity is on the span, not stranded in a log line three services away. On Tempo 3.0 you can even push that into a TraceQL metric and chart the rate of denials for a principal straight off the trace data. That's not observability any more. That's evidence.
Security · Audit · Integration
Security: identity is attached server-side from a validated claim and never rides in a cleartext header or baggage — the trace gains a subject without opening a PII leak.
Audit: one trace-id reconstructs a named customer's full path across every hop, including the hops that denied them — the proof the control fired, not just that it exists.
Integration: Entra answers who (the oid on the span), the mesh answers what and between whom (the SPIFFE peer, the verdict), and OpenTelemetry is the thread that makes them one story instead of three.
You could also not use Tempo
Jaeger and Zipkin are mature, self-hostable, and store the same OTLP spans — reach for them when your team already runs one and the LGTM stack isn't in the building. Tempo earns its place when you're already living in Grafana for the other three signals and you want the trace to link to the log line and the metric without leaving the pane; that single-pane correlation is the integration win, not the storage engine.
Datadog APM and Honeycomb are excellent products and the wrong default here for the reason this whole series keeps hitting: a managed trace store outside the country fails RBI localization and KSA in-Kingdom residency unless you can pin the region, and for most of these you can't pin it hard enough to satisfy an assessor. Self-hostable keeps the evidence in the jurisdiction that's going to audit it.
On the wire: prefer W3C traceparent/tracestate, which is the .NET and Istio default; keep b3 only if a legacy service in the chain speaks nothing else. And on identity specifically — the tempting alternative is baggage, so that the id “just flows.” It's the wrong call for anything regulated. Baggage crosses trust boundaries in the clear. Enrich the span in-process instead. Slightly more code, no leak.
From simple to standard
The toy version traces everything at 100% and keeps it all. The standard version can't — you'd melt your storage bill and your ingesters. So teams sample. And here's the trap nobody budgets for: head-based sampling makes the keep/drop decision before it knows whether the request was interesting, which means it will cheerfully throw away the one trace an auditor asks for six months later, because at 1% sampling the denied transaction wasn't special enough to survive the coin-flip.
The industry-grade answer is to stop treating audit traces like ops traces. Sample the healthy 200s down hard, but keep the security-relevant lanes whole: every denial, every auth failure, every trace on your cardholder-data or payment paths. Tail-based sampling, or a policy that force-keeps on response_code >= 400 and on your sensitive services, buys you a small store that still holds the traces you'll actually be asked to produce. “It's on now” is not the same as “it was captured then.”
Two more standard-grade moves. Correlate the trace back to the audit log by writing the trace-id as a field on every log line — then a regulator's question jumps from log to trace to metric on one id, which is the end-to-end user-lifecycle visibility this series promised back when we were forwarding tokens on-behalf-of in Article 17. And discipline the PII: opaque oid on the span, never the email, never the PAN, never the token — because a trace store, like the log store before it, sits on mutable object storage. Tempo 3.0 even ships a redact command to scrub blocks after the fact, which is a fine tool and also a quiet admission: keeping the trace and proving nobody edited it are two different jobs. We named that gap for logs. It's the same gap for traces, and it's why the next article stops collecting evidence and starts signing it.
Next up — Article 27: Turning telemetry into signed evidence. The trace store is mutable and ships a delete API. A record an operator can quietly rewrite is not evidence, however complete. Time to make it tamper-evident.
Full runnable sample — the OTel pipeline, the enricher, the Istio Telemetry config, and the TraceQL queries — in the companion repo under /26-tracing-identity.
Key skills & topics in this article
Distributed tracingLGTM stackCompliance evidenceIstioOpenTelemetry.NET & C#Audit logging
Also on LinkedIn.