The LGTM stack for compliance evidence
The Mesh Series · Article 25
LGTM stackCompliance evidenceDistributed tracingMulti-cluster & residencyOpenTelemetryDrift & posture.NET & C#mTLS
Loki, Grafana, Tempo, Mimir. Four letters everyone treats as one observability blob. To a regulator they answer four different questions, and putting the wrong signal in the wrong store fails you two ways: you can’t produce the evidence, or you detonate the bill.
Your platform team already runs LGTM. Someone stood up Loki for logs, Mimir for metrics, Tempo for traces, and Grafana on top, and now there’s a dashboard wall that lights up when something breaks at 2 a.m. That stack is observability, and it works.
Then an auditor sits down and asks a different question. Not “is the payments service healthy right now.” They ask: show me every access to the cardholder-data service by this identity, for the last ninety days, and prove the record wasn’t edited. And the same LGTM stack — same four letters — is now being asked to be evidence.
Observability and evidence run on the same pipes. They are not the same job. Observability answers is it healthy. Evidence answers can you prove what happened, to whom, under whose authority, for how long — in a form that survives a hostile reading. Article 24 drew that line for one signal: an access log is not an audit trail. This article draws it across all four. Because the useful thing about LGTM, once you stop seeing it as a monolith, is that each store proves a different class of claim — and the whole game is putting each signal where it can actually be produced under audit.
Four stores, four questions
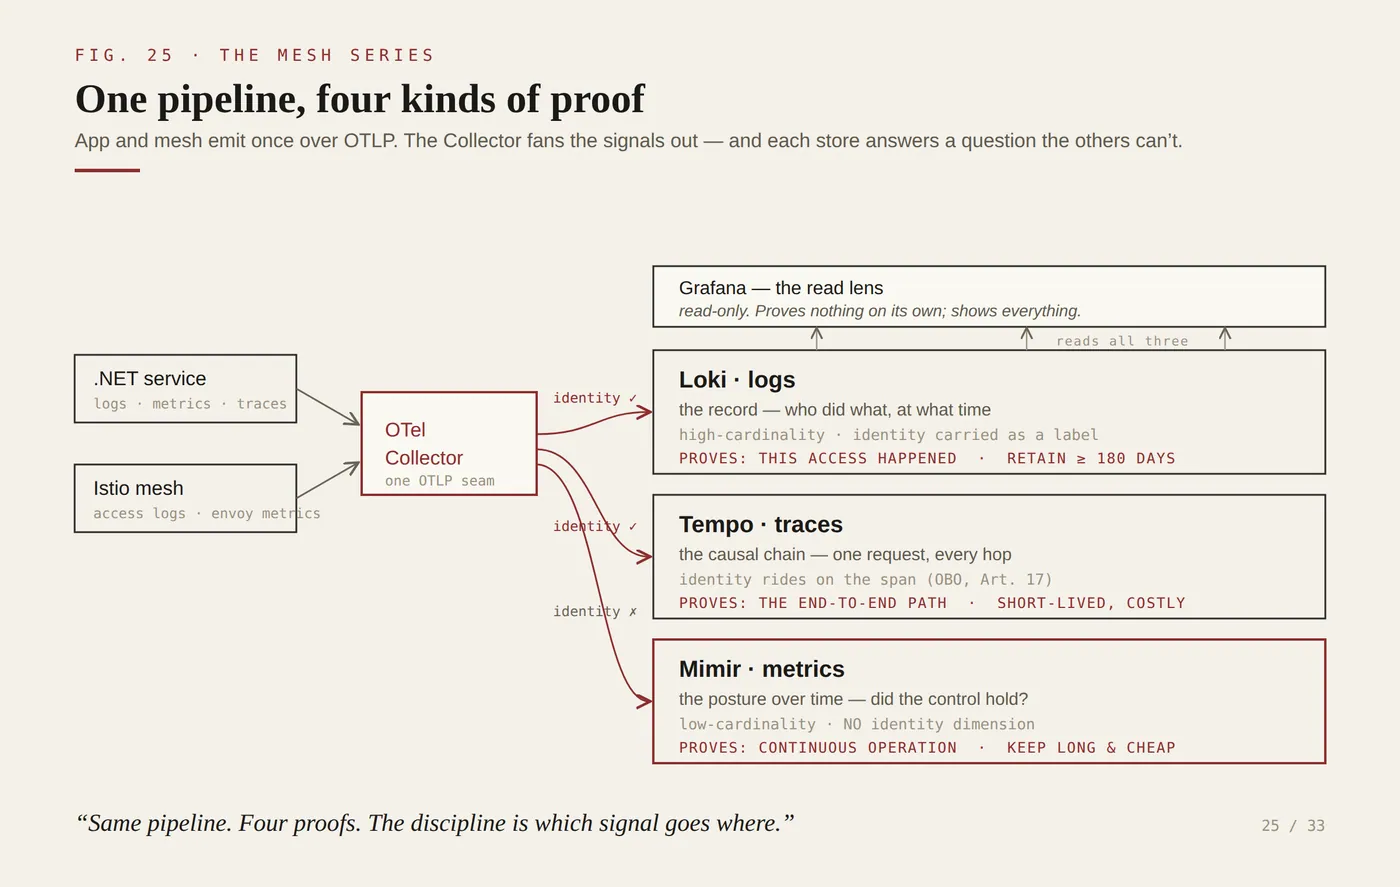
Stop reading LGTM as “the observability stack.” Read it as four evidence stores with four jobs.
Loki — the record. Logs are discrete events. The access line from the mesh (SPIFFE identity, Entra JWT principal, verdict, response flags — everything Article 24 built) and the business action from the app. This is your audit trail: who did this specific thing, at this specific time. High-cardinality by nature — every request is its own line, stamped with identity. That’s a feature here, not a cost to be optimised away.
Tempo — the causal chain. A trace is one request stitched across every hop it touched, in order. The user hits the gateway, the gateway calls the API, the API calls three downstream services, and Tempo shows you that whole path as a single object — with the identity riding along on the span (the On-Behalf-Of propagation from Article 17). Loki proves the event happened; Tempo proves the path it took. When an auditor says “walk me through transaction X end to end,” that’s a Tempo question, and nothing else in the stack answers it.
Mimir — the posture over time. Metrics are aggregates. Not “user A was denied at 14:32” — that’s a log — but “the deny rate held at its baseline across the quarter” and “mTLS coverage stayed at 100% for ninety days.” Low-cardinality, cheap to keep for a long time, and it’s the only signal that proves a control operated continuously rather than passing once on assessment day. Hold that thought; it’s the one most regulated shops under-build.
Grafana — the lens, not the evidence. Here’s the contrarian line that trips people: Grafana proves nothing. It’s the pane of glass you look through at the other three. A dashboard is a rendering, and a rendering is mutable — anyone with edit rights changes the panel, the query, the time range. A screenshot of a Grafana panel is the weakest audit artifact you can hand over, and I’ve watched teams reach for exactly that under pressure. The evidence is the immutable store underneath, and the signature on it (Article 27). Grafana is how the auditor reads the evidence. It is not the evidence.
So the four evidence questions map cleanly, and the map is the whole point:
Prove this identity accessed this resource at this time → Loki.Prove that request, end to end, across every service → Tempo.Prove the control operated continuously for the audit period → Mimir.Let the auditor look for themselves → Grafana.
Get the mapping wrong and the failures are specific, not vague. Put identity in Mimir and you blow up cardinality — every user ID becomes a new time series and the metric store falls over (Article 24 banked that rule: audit goes to Loki, never Mimir). Try to prove ninety-day continuity from logs alone and you can’t — logs answer “did this event happen,” not “did this hold the whole time,” and the query to reconstruct a trend from raw lines across ninety days is the query that times out. Signal-to-store fit isn’t tidiness. It’s whether the evidence exists when someone asks for it.
Why it matters for regulated institutions
The gap between observability retention and evidence retention is where this stops being an architecture discussion and becomes a legal one.
Your platform team keeps logs for seven, maybe fifteen days. That’s rational — it’s how far back you ever look to debug a live incident, and object storage for two weeks of logs is cheap in whatever region the cluster happens to sit. As an observability decision it’s correct.
As a compliance decision it fails on two axes at once, and both are law in the markets this series is built for.
Axis one, duration. India’s CERT-In directions require security logs retained for 180 days. PCI-DSS 4.0 wants a year of audit history, with ninety days readily available. A fifteen-day default doesn’t miss the bar by a little; it misses it by an order of magnitude. The auditor asks for a record from four months ago and it rolled off before the question was asked.
Axis two, residency. CERT-In wants those 180 days held within Indian jurisdiction. RBI’s payment-data localization keeps payment-system data only in India. Saudi Arabia’s NCA and PDPL expect financial data in-Kingdom; the UAE frameworks carry their own residency duties. Your cheapest-region object storage bucket may sit in a datacentre that fails all of them. The retention default and the residency default are both quietly wrong for a regulated workload, and neither shows up until an audit — the demo-to-audit gap, made statutory.
And then there’s the axis observability never has to think about at all: continuous proof. SAMA’s Cyber Security Framework doesn’t grade you on whether a control was configured on the day of assessment. It’s a maturity model — it wants evidence the control operated over time. That’s not a log query and it’s not a screenshot. That is precisely the Mimir time series most teams never kept, because ops didn’t need it. Ops watches the live panel. The auditor wants the ninety-day line proving mTLS never dropped, the deny-rate never went slack, the certificate age never crept past rotation. If you didn’t record the posture continuously, you cannot reconstruct it after the fact. There is no backfill for a metric you didn’t emit.
That’s the uncomfortable reframe: the part of LGTM that carries the most regulatory weight — continuous posture in Mimir — is the part an ops-first stack invests in least, because an ops-first stack is tuned for “is it healthy now,” and now is the one timeframe a maturity model doesn’t care about.
How the pieces come together
The thing that makes this tractable — and the reason you don’t instrument four times — is that OpenTelemetry is the single collection seam, and everything upstream of the stores is one pipeline.
Your .NET service emits all three signals through one OTLP exporter (OpenTelemetry for .NET is on the 1.17 line, GA and stable on .NET 10). Logs, metrics, and traces leave the process in one vendor-neutral protocol, hit an OpenTelemetry Collector, and the Collector fans them out: logs to Loki, traces to Tempo, metrics to Mimir. You instrument once and route by signal. The application code never names a backend — which is also what keeps you portable when someone asks to swap the store (hold that for the alternatives).
The mesh feeds the same three stores without you writing app code for it. Istio’s Telemetry API (Istio 1.30.3, the current stable line — the one carrying the fix for the JWKS-fallback CVE from Article 23) ships the access logs to Loki through the envoyOtelAls provider — that’s the call-level record with the SPIFFE SAN and the Entra principal from Article 24. Envoy’s own metrics — request counts, mTLS status, response codes in aggregate — flow to Mimir as the coverage posture. And the trace headers the mesh propagates (traceparent, the b3 set) are what let Tempo stitch the hops into one trace. Same identity, three destinations, and — this is the discipline — identity lands as a label on the log and an attribute on the span, never as a dimension on the metric.
There’s a clean division of labour underneath it that mirrors Article 23’s line, “the mesh authorizes the call, not the object.” The mesh logs the call — uniform, unforgeable, and it captures the denied request too, which is itself evidence the control fired. The app logs the object — the business action the mesh can’t see inside. Tempo’s trace-id is the thread that sews the mesh’s view and the app’s view into one story (that stitch is Article 26’s whole subject — here we just make sure the identity is on the span so there’s something to follow).
Show the code
Two things worth seeing. First, the collection seam: instrument once, emit OTLP, let the Collector route. This is the .NET 10 / OTel 1.17 wiring, and the notable part is how little of it is signal-specific.
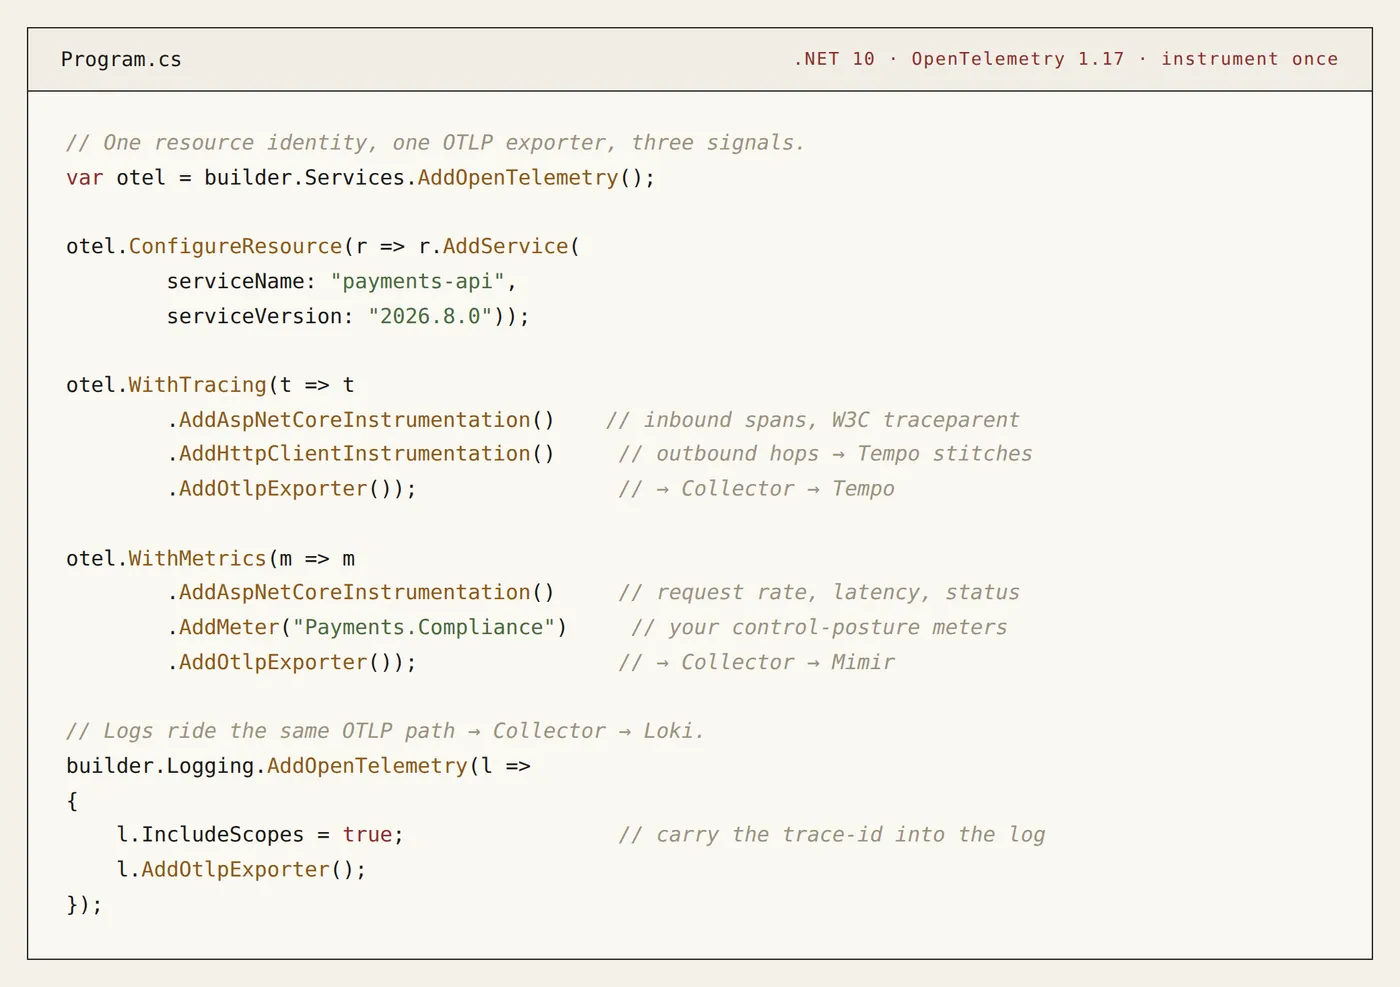
One exporter target, one resource identity, three signals leaving the process. The application never mentions Loki, Tempo, or Mimir — the Collector decides where each signal lands.
Second, and this is the payoff card: the same audit question, answered against each store in its own query language. This is what “each letter proves a different thing” looks like when the auditor is standing over your shoulder.
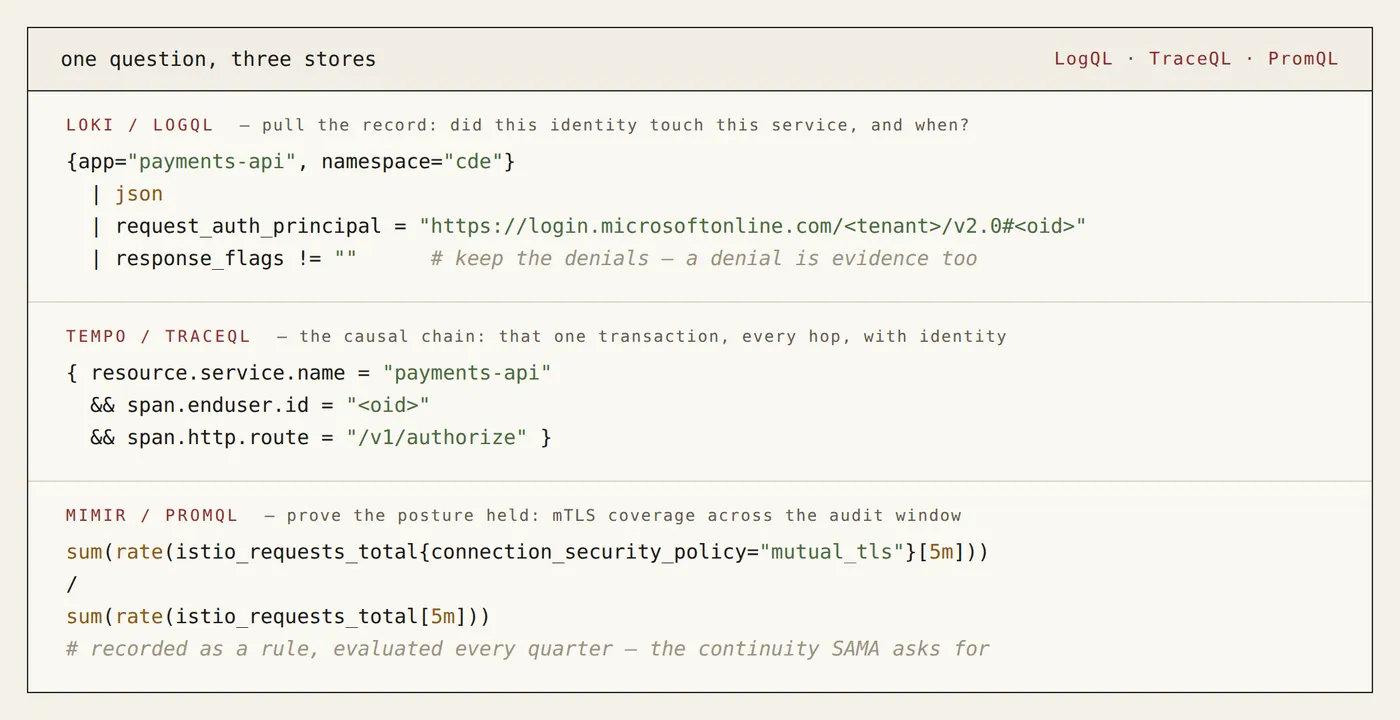
Three questions, three stores, three languages — and none of the three can answer the other two’s question. That constraint is the architecture. The LogQL query filters on a per-request identity label Mimir must never carry; the PromQL query computes a ratio over time that Loki would time out reconstructing. Right signal, right store.
Security · Audit · Integration
Security property. Separation of concerns as a safety property: identity and per-event detail live in the high-cardinality stores (Loki, Tempo) where they belong; the metric store stays low-cardinality and survives. Cross the streams and you either lose the evidence or lose the store.
Audit evidence. Four claims, cleanly sourced. The discrete access record (Loki). The end-to-end request path with identity (Tempo). The continuous-operation proof a maturity model demands (Mimir recording rules). And a read surface an auditor can drive themselves (Grafana) — read-only, so the lens can’t rewrite the record.
Integration. OpenTelemetry is the one seam. App and mesh both emit OTLP; the Collector fans out; the stores specialise; Grafana federates the read. Instrument once, route by signal, and the identity that started at the Entra token (Article 12) is still attached when the evidence is queried ninety days later.
Alternatives, and when you’d pick them
Elastic / the ELK stack. Mature, powerful search, and plenty of regulated shops run it for logs. But it’s log-and-search-centric; metrics and traces bolt on rather than sharing one model, and the operational weight at retention scale is real. Pick it when your evidence story is overwhelmingly log-search and your team already lives in Kibana.
Datadog and the SaaS observability platforms. Genuinely excellent products, and if you’re not residency-bound they’ll save you a platform team. But the data leaves your jurisdiction to reach them, and you don’t own the retention or the storage location. For an RBI, SAMA, or CERT-In workload that’s frequently a hard stop, not a preference. Pick SaaS when residency doesn’t bind you and you’d rather buy the ops than run it.
Azure Monitor / Log Analytics. The native path on AKS, and clean if you’re already all-in on Azure. The catch is the same one Article 24 flagged — residency and the degree of control over where the data physically sits. Pick it when your region posture and the regulator’s residency demand actually line up, and confirm that before you commit the audit store to it.
The move that matters more than the store you pick: keep OpenTelemetry as the collection layer regardless. Emit OTLP from the app and the mesh, and the backend becomes swappable — LGTM today, something else if residency or cost forces a move, with no reinstrumentation. The lock-in that hurts isn’t the store; it’s app code welded to a vendor’s SDK. Don’t weld it.
Self-hosted LGTM earns its keep precisely where regulation bites: you control retention per signal, you control which country the object storage sits in, and there’s no per-host bill detonating as you scale audit history to a year. That’s not “LGTM is better.” It’s LGTM fits the residency-plus-retention-plus-cost corner that regulated institutions are cornered into.
From simple to standard
The toy version is one service exporting OTLP to a local LGTM in kind, with Grafana showing you a trace, a log line, and a live graph. Satisfying, and it proves nothing to an auditor.
The industry-grade version is the same shape with the compliance-shaped edges filled in. Retention tiered per signal — traces are expensive and short-lived, logs held to the 180-day statutory floor, metrics kept long and cheap because that’s where the multi-quarter continuity proof lives. Object storage pinned to an in-country region because residency is non-negotiable. The continuous-posture metrics written as recording rules so the mTLS-coverage line and the deny-rate baseline are computed and retained as first-class evidence, not reconstructed on demand. And, as the auditor-facing surface matures, a read-only Grafana scoped to the evidence an assessor is entitled to see — the auditor portal this whole layer builds toward.
We now have identity sitting on the log line and on the trace span. Next we follow it: Article 26 is tracing identity through a request end to end — Tempo and OpenTelemetry in C#, turning the propagated token from Article 17 into a single, auditable, user-annotated trace.
Key skills & topics in this article
LGTM stackCompliance evidenceDistributed tracingMulti-cluster & residencyOpenTelemetryDrift & posture.NET & C#mTLS
Also on LinkedIn.