If you can’t prove it, it didn’t happen — audit logging in the mesh
The Mesh Series · Article 24
Audit loggingCompliance evidenceLGTM stackIstio.NET & C#Distributed tracingMicrosoft Entra IDSPIFFE
Kubernetes · Istio Service Mesh · C#/.NET · Microsoft Entra ID
Your mesh is already logging. Every request through a sidecar produces an access log line — method, path, response code, duration — whether you asked for it or not. So the audit box is ticked, right?
No. You have an access log. You do not have an audit trail. They look identical in a terminal and they answer completely different questions, and the gap between them is exactly the gap an auditor walks into.
An access log answers is it healthy — the question you have at 2 a.m. when latency spikes. An audit log answers who did what, when, under whose authority, and can you prove the record wasn’t touched — the question a regulator has eighteen months after the fact, when nobody who wrote the code still remembers the deploy. The mesh hands you the first for free. It lets you mistake it for the second.
The line that separates them isn’t a tool. It’s four fields and a retention policy.
Why an enterprise institution can’t wave this off
The regulator’s question is never “do you have logs.” Everyone has logs. The question is “show me who accessed this data on this date, prove they were authorized, and prove this record is the original.” Three demands, and your default access log answers none of them.
In India the clock is written down. CERT-In’s April 2022 directions give you six hours to report a cyber incident from the moment you notice it, and require logs retained 180 days within Indian jurisdiction. Six hours is not enough time to go grepping across a cluster hoping the identity was captured somewhere. Either the record exists, in a queryable store, with the actor named — or the window closes and you are reporting an incident you cannot describe.
In Saudi Arabia the shape is different but the pressure is the same. SAMA’s Cyber Security Framework is assessed on a maturity model: you don’t pass by showing a control existed on assessment day, you pass by proving it operated continuously. A control with no evidence trail is, to a SAMA assessor, a control that didn’t run. And the data that proves it — like the payment data itself — often can’t leave the Kingdom to be analyzed. Same story in India’s payment-data localization, same story under DIFC and ADGM breach-notification duties.
This is the demo-to-audit gap in its purest form. In the demo, the request works and the log scrolls past. In the audit, the log is the deliverable, and the parts you didn’t think to capture are the parts you get asked about first.
How the pieces actually come together
Here’s the split nobody draws cleanly. You have two logs, and neither one is the audit trail on its own.
The mesh logs the call. Envoy sees every request cross a workload boundary and knows things the application never will: the calling workload’s cryptographic identity (the SPIFFE SVID from mTLS), the end-user principal Istio validated at the edge (the Entra JWT’s <iss>/<sub>), the authorization verdict, the response flags. This is the who and the whether-it-was-allowed. It’s uniform across every service in the mesh, in a language the app can’t forge, and — critically — it captures the requests that were denied. The call default-deny blocked (Article 16). The tokenless request the gateway rejected 403 (Article 11). The egress the policy refused (Article 22). The thing that didn’t happen because a control stopped it is often your single most valuable piece of evidence, and it exists only in the mesh’s log, because it never reached your code.
The application logs the object. The mesh can prove service X, acting for user Y, called POST /payments/9931. It cannot prove what that call did to payment 9931, because to the mesh that’s an opaque byte stream. Only your service knows the business action — approved, reversed, exported. This mirrors the boundary from Article 23: the mesh authorizes the call, not the object; here, the mesh logs the call, not the object.
Stitch them with one thing: the trace ID. The same correlation identifier rides the request through the gateway, through the mesh access log, into your application’s structured log, across every downstream hop where identity propagates (Article 17). That’s what turns two disconnected log streams into one answerable question — everything user Y touched, in order, with the authority they carried — which is the end-to-end user activity and lifecycle view that makes an audit tractable instead of archaeological.
Show the config
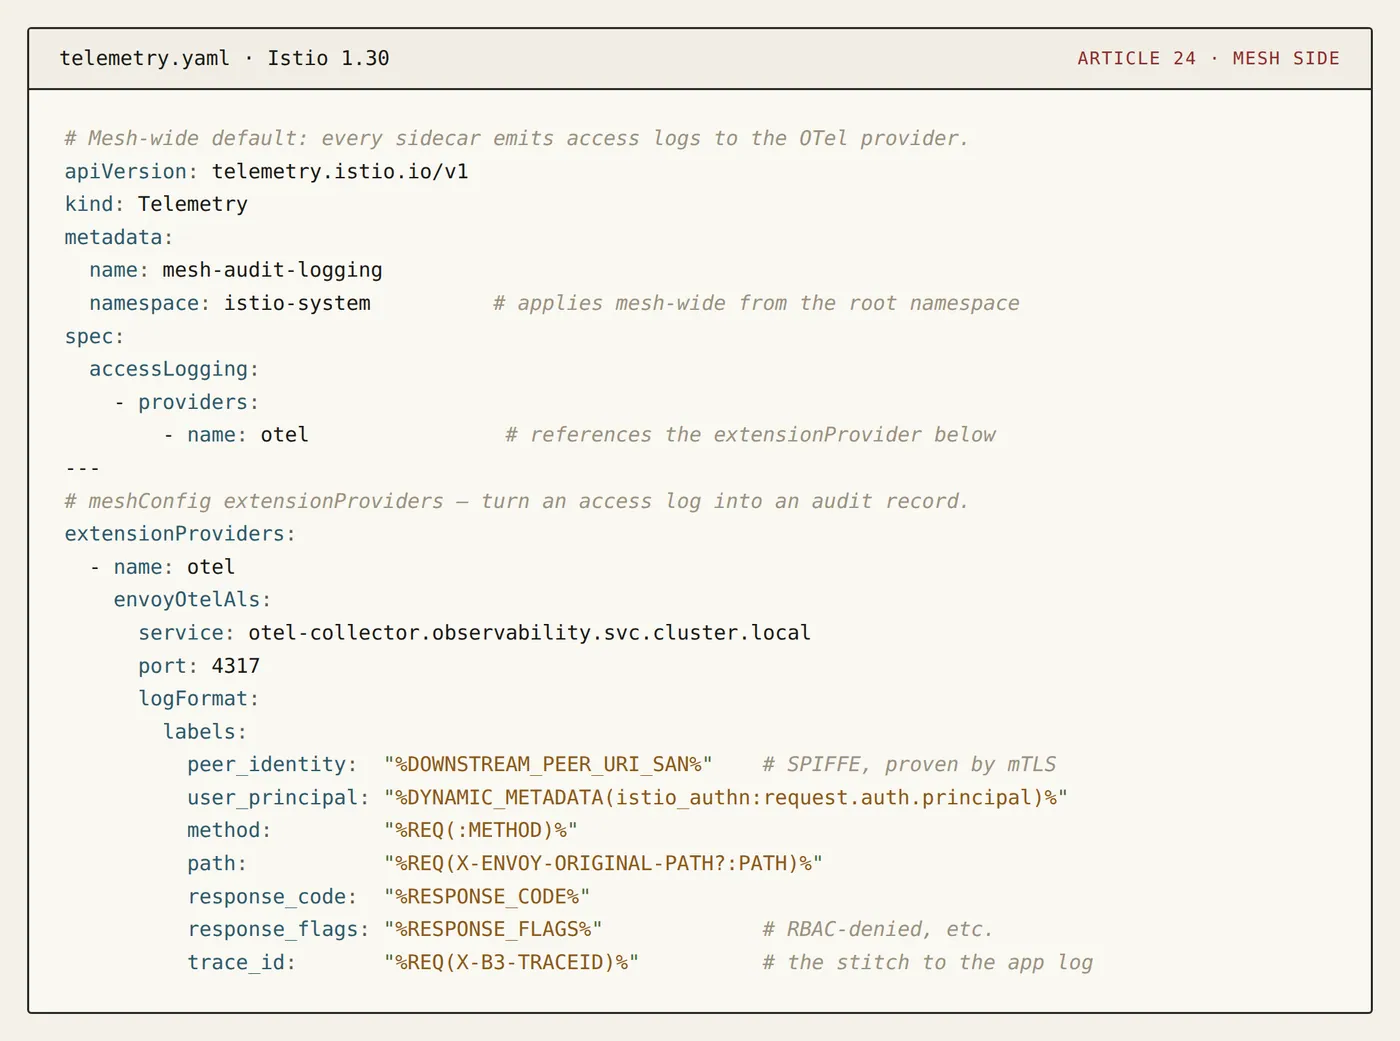
First, the mesh side. The Telemetry API (telemetry.istio.io/v1) is now the first-class way to configure this — it supersedes the old meshConfig.accessLogFile knob. A single mesh-wide default in istio-system turns on access logging for every workload and ships it to an OpenTelemetry collector. That gets you a log — but not yet evidence. The default format is method, path, response code: the ops fields. The audit-grade version lives in the provider definition, where you name the identity fields explicitly.
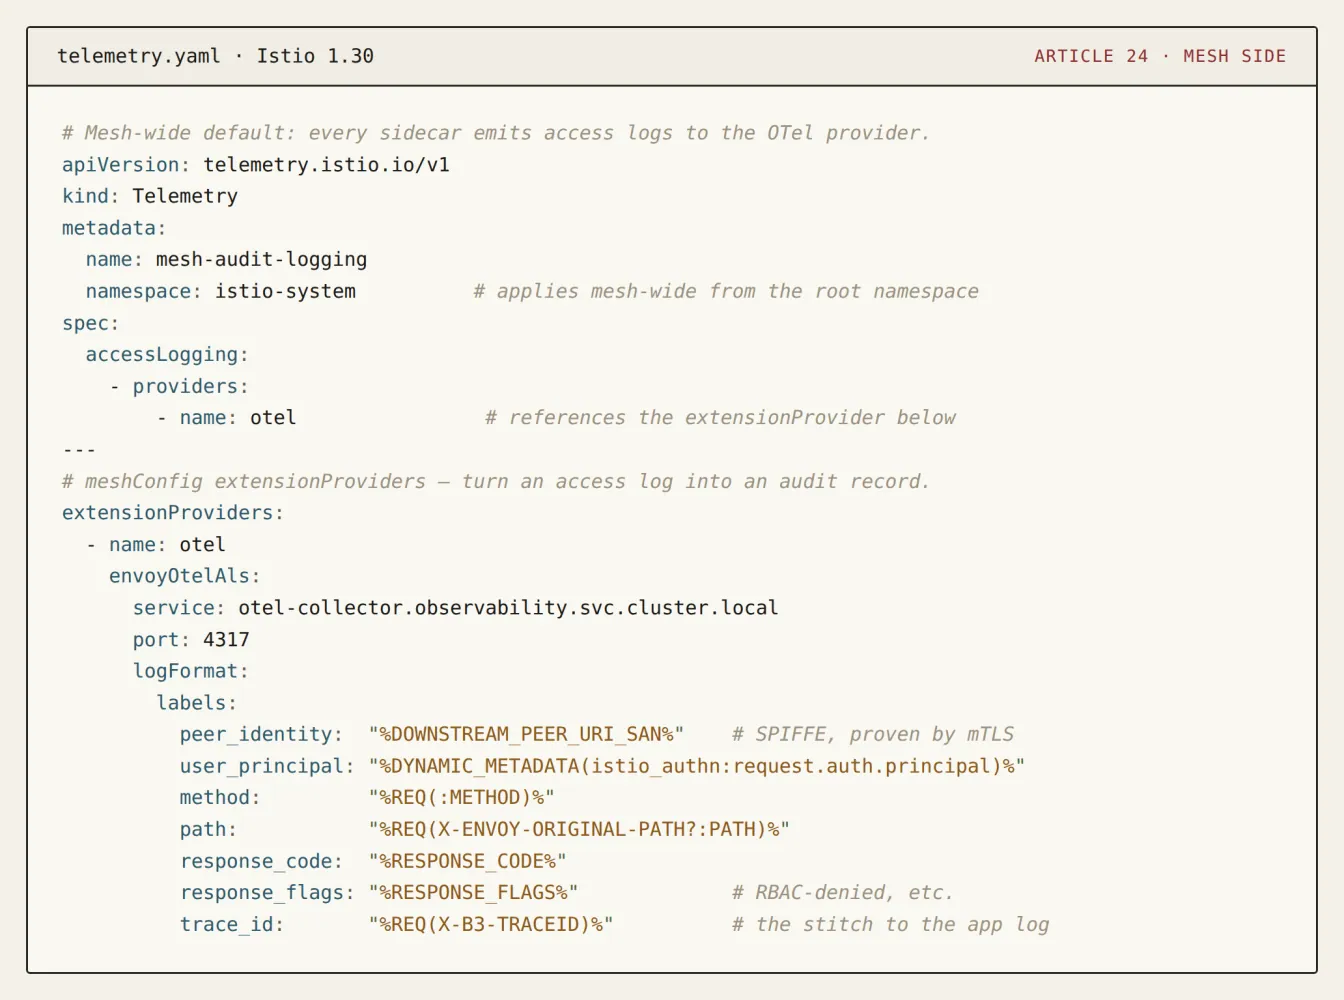
%DOWNSTREAM_PEER_URI_SAN% is the SPIFFE identity the caller proved over mTLS — you cannot spoof it with a header. %DYNAMIC_METADATA(istio_authn:request.auth.principal)% is the user identity Istio’s JWT filter validated, not one the app trusted blindly. Those two fields are the difference between “a request happened” and “this authenticated workload, acting for this authenticated user, was allowed to do this.” That’s an audit record.
You don’t want every line at this fidelity forever — cardinality has a cost, and we’ll come back to it. Trim the noise with a CEL filter (keep the failures and the sensitive paths, drop the health checks). Mind the documented gotcha: on a failed connection there is no response.code at all, so guard for it with !has(response.code) || response.code >= 400.
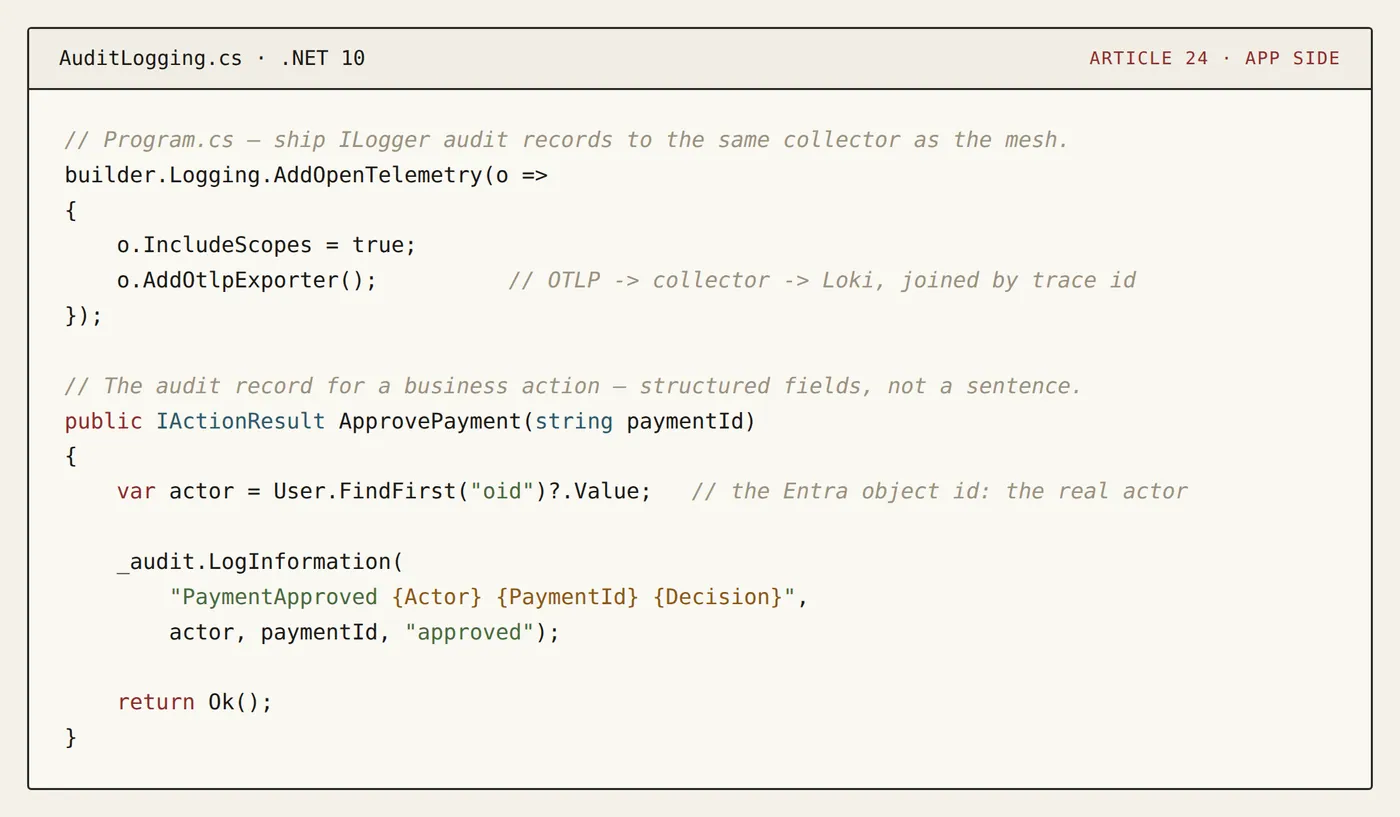
Now the application side. The mesh proved the call; your service records what the call did, as a structured log the same collector ingests over OTLP (OpenTelemetry .NET, exporter on the 1.17 line). The rule that matters — the one that gets skipped — is that an audit log is written for the caller’s benefit after the fact, so you log the actual identity, action, and object as data fields, never as a prose sentence you’ll later have to parse.
And the failure path, because this is where the scar lives. When authorization or token validation fails, the instinct is to log the friendly message — “Authentication failed.” That sentence is worthless as evidence. It tells an investigator nothing about which identity failed which check why. I’ve been bitten by exactly this from the other side: a JWKS key-rotation failure that never surfaced as a clean IDX10500 — it came through as a generic network exception, no mention of “signature” anywhere, and the only way to trace it was by timing (Article 12). The lesson generalizes straight into audit logging.
[ IMAGE — code-24c-rawexc.png · .NET 10: log the RAW exception and the identity that failed, not the sanitized message ]
The friendly message is for the user. The raw exception is for the auditor. Log both to different places; never let the friendly one be the only record.
Security · Audit · Integration
Security property gained. Every request that crosses a workload boundary — allowed or denied — leaves a tamper-resistant record naming the cryptographic workload identity and the validated user principal. Denied requests are captured too, which means an attempted policy violation is evidence the control worked, not a silent non-event.
Audit evidence produced. A queryable, retained, in-jurisdiction trail that answers the three regulator questions: who accessed this (SPIFFE + Entra principal), were they authorized (the verdict and response flags), what did they do to the object (the correlated application record). CERT-In’s 180-day, in-country retention and SAMA’s continuous-operation proof both map directly onto this store.
How it integrates. The mesh Telemetry resource and the application’s OTLP exporter feed one collector, stitched by trace ID — the same identity that Entra validated at the edge (Article 11), that mTLS proved between workloads (Article 14), that On-Behalf-Of propagated across hops (Article 17). Audit logging isn’t a new subsystem. It’s the read-out of the identity plane you already built.
Alternatives, and when you’d reach for them
The mesh access log has one structural blind spot, and it’s the same one from Article 20: it only sees traffic it terminates. A non-mesh pod — a DaemonSet, a node agent, a kubectl exec into a running container — opens a raw socket and does its work entirely beneath Envoy’s view. No access log line. No audit record. If your threat model includes the workload itself being compromised, or an operator on the node, the mesh log will never show it.
That’s where eBPF runtime audit earns its place. Falco (0.44.1, June 2026) and Cilium Tetragon watch at the syscall boundary in the kernel — process execution, file opens, network connects — below the mesh, below the application, where a compromised container can’t hide by avoiding the sidecar. Reach for it when you need to prove what a workload did on the host, not just what it asked another service to do. The trade-off is volume and signal-to-noise: kernel-level events are a firehose, and turning them into audit evidence rather than alert fatigue is its own project.
Two more you’ll be tempted by. Application-only audit logging — skip the mesh, just log in code — is simpler, and it’s what most teams do first. It fails the uniformity test: every service invents its own format, half of them forget the denied requests, and you cannot prove a service that was supposed to log actually did. The mesh log is the independent witness the app can’t suppress. And the cloud-native path (Azure Monitor / Log Analytics ingesting both streams) is a legitimate destination — until the data can’t leave the country. Under RBI localization or KSA in-Kingdom residency, “ship it to the managed service” quietly becomes “ship regulated data across a border,” and now your logging pipeline is the compliance finding. Keep the store where the data is allowed to live.
From the toy to the standard
The toy is one Telemetry resource and an ILogger call. The industry-grade version is three disciplines the toy skips.
Retention and jurisdiction. 180 days in India, continuously in Saudi, in-country in both. That’s a Loki store sized and located deliberately — not logs that roll off at whatever the default disk pressure decides.
Cardinality, honestly. This is the open trap. It is tempting to promote every audit field to a metric label so you can chart it. Don’t. High-cardinality identity fields — user principal, payment ID, trace ID — will detonate a metrics backend like Mimir, because each unique value is a new time series. Audit data belongs in a log store you query (Loki), not a metrics store you aggregate (Mimir). Log the identity; count the verdicts. Keep the two straight or the observability bill teaches you the difference.
Tamper-evidence. The uncomfortable one. A log an operator can edit is not evidence — it’s a note. Right now, everything above lands in a store someone with the right access could alter, and to a regulator that means the record proves nothing. The access log tells you a request happened; it does not yet prove nobody rewrote the record afterward. Closing that gap — signing the evidence so tampering is detectable — is a separate job, and it’s where this arc is heading (Article 27).
Because that’s the through-line of everything in Part D: if you can’t prove it, it didn’t happen. Not “if it didn’t happen.” If you can’t prove it. The mesh just made proving it possible. Next we widen the lens to the full LGTM stack — Loki, Grafana, Tempo, Mimir — and ask what each signal actually proves, and where the evidence lives.
Key skills & topics in this article
Audit loggingCompliance evidenceLGTM stackIstio.NET & C#Distributed tracingMicrosoft Entra IDSPIFFE
Also on LinkedIn.